Timeline
Visualise a process or series of events that took place over a specific timeframe.
Details
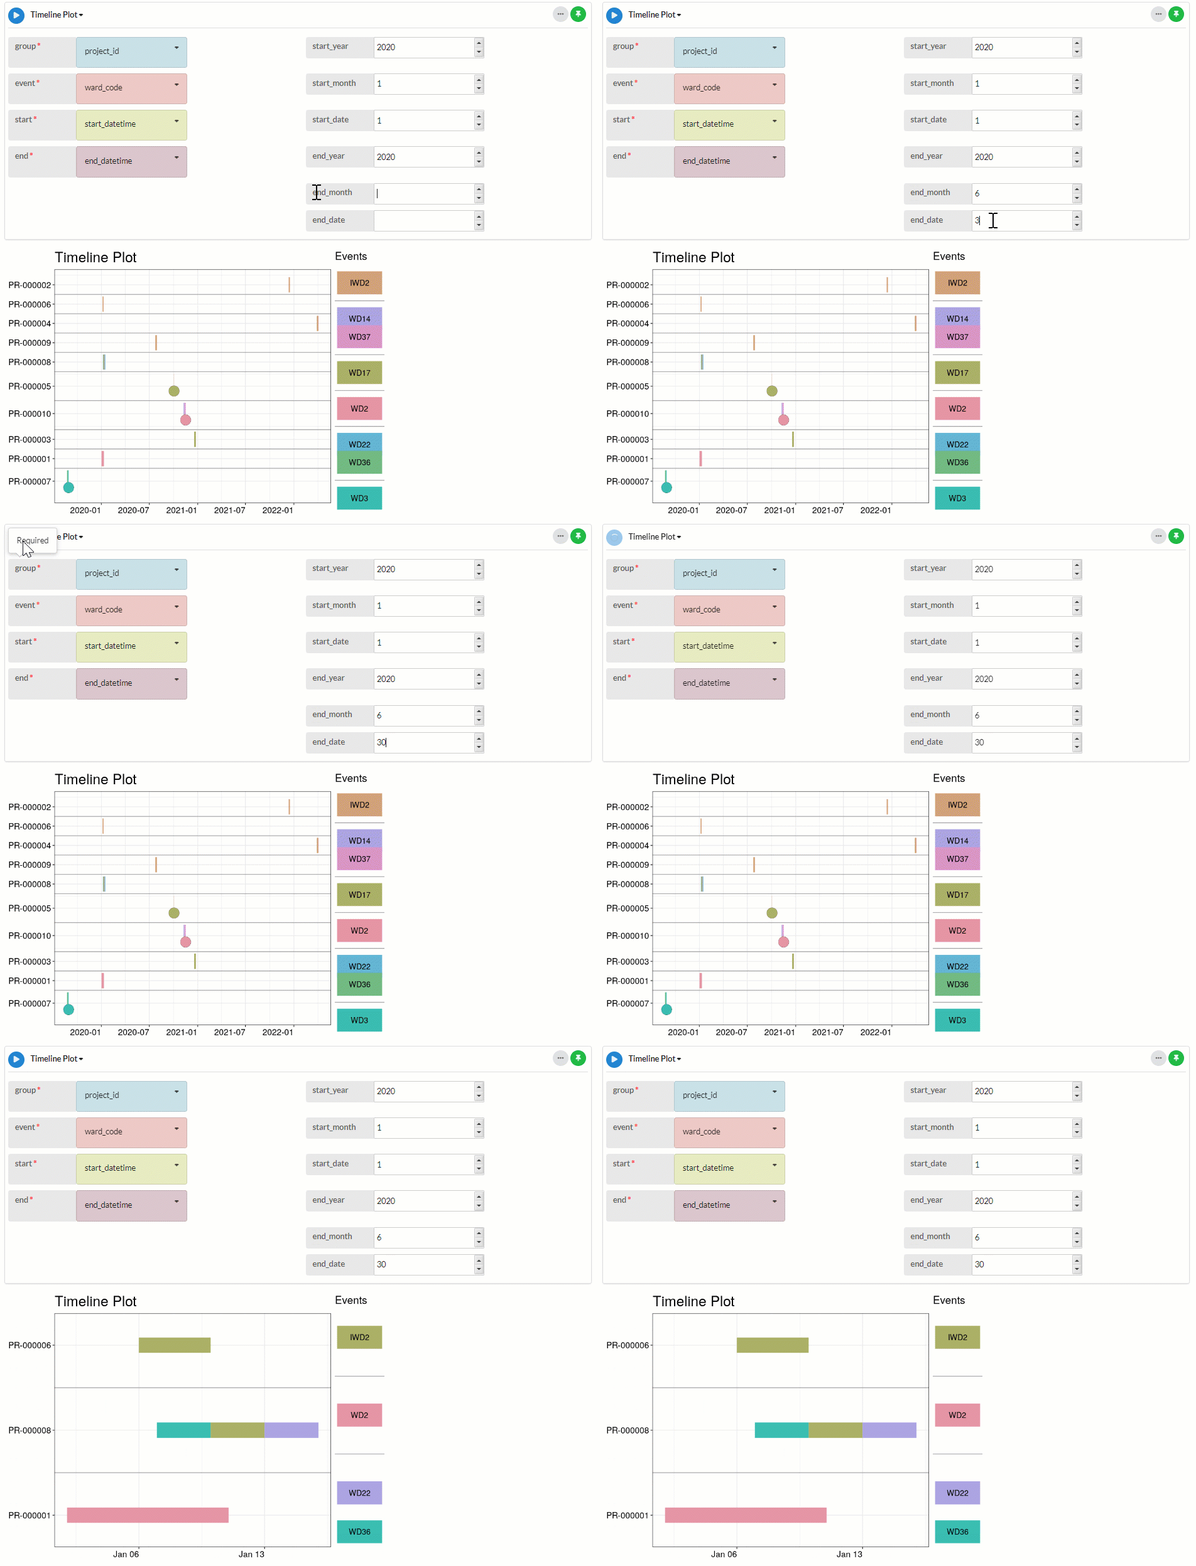
A Timeline plot displays a list of events for a corresponding set of groups based on start and end dates provided from the data table.
Timeline plots are ideal during exploratory analysis of any timeseries data to investigate the relationship, dependency, and trend within the data over the time.
Output
The example below shows the timeline of which ward and how long different patients stayed at a hospital.

Parameters
| Variable name | Required | Constraints | Description |
|---|---|---|---|
| Group | Yes | Column Input. Maximum of 20 unique values. | The values of this column will be used for the group that the event applied to. |
| Event | Yes | Column Input. Maximum of 20 unique values. | The values of this column represent the events that applied to the group. |
| Start | Yes | Column Input. Date, DateTime | The values of this column will be used for the start dates for the events. |
| End | Yes | Column Input. Date, DateTime | The values of this column will be used for the end dates for the events. |
| Start_year | No | Integer between 1900 and 3000. | Specify the year that the timeline will begin. |
| Start_month | No | Integer between 1 and 12. | Specify the month that the timeline will begin. |
| Start_date | No | Integer between 1 and 31. | Specify the date that the timeline will begin. |
| End_year | No | Integer between 1900 and 3000. | Specify the year that the timeline will end. |
| End_month | No | Integer between 1 and 12. | Specify the month that the timeline will end. |
| End_date | No | Integer between 1 and 31. | Specify the date that the timeline will end. |
Updated on October 13, 2025
