Administering Cohort Builder
Cohort Builder is disabled by default on each dataset, so that Data Owners control the use of it on their datasets.
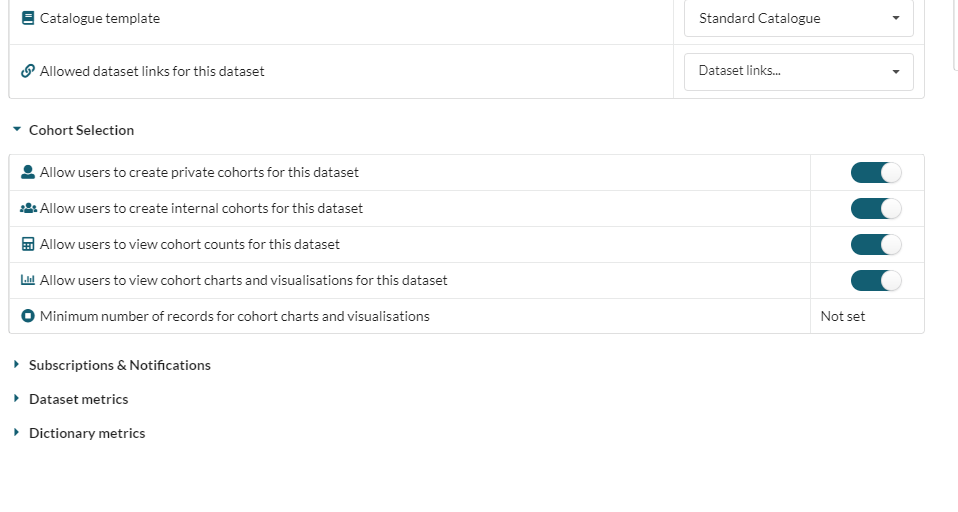
This is managed from the dataset Administration tab using the Cohort Selection Permissions.

The cohort permissions are:
| Permission | Description |
|---|---|
| Allow users to create private cohorts for this dataset | Allows users to create cohorts that can be shared with named users. |
| Allow users to create internal cohorts for this dataset | Allows users to create cohorts that are visible to all users with permission to view the parent dataset |
| Allow users to view cohort counts for this dataset | Enables/disables the count feature of the cohort UI |
| Allow users to view cohort charts and visualisations for this dataset | Enables/disables the visualisation feature of the cohort UI |
| Minimum number of records for cohort charts and visualisations | Allows data owner to set a minimum cohort size below which cohort visualisations are disabled in the UI |
Cohort Builder is enabled on a dataset when users are given the permission to create private or internal cohorts. If both of these permissions are disabled then Cohort Builder will not be available on a dataset.
Dictionary and Field visibility
Data Owners also have the ability to exclude sensitive fields from Cohort Builder when it is enabled.
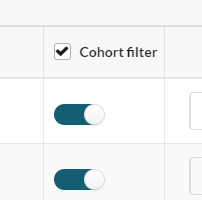
This is managed in the Cohort Filter column of each dictionary table in a dataset:

The Data Owner can enable or disable all the fields in a dictionary at the same time using the tick box in the column header, or they can use the toggles to enable or disable each field individually.
Fields disabled in the Cohort Builder cannot be selected as filters in the query builder and are not available to view as visualisations. However, they will still be included in any data transfers of the cohort.
When a new dataset is created all fields are excluded from Cohort Builder by default.
Entity Flag

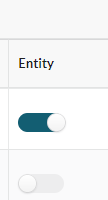
The Data Owner can also choose to mark dictionary fields with the entity flag. This identifies the field as a unique value within the dictionary, and when applied records that share the value will only be counted once in cohort counts.
For example, if a dictionary contains the field Patient ID, then the data owner may want to apply the entity flag to this field. If the dataset contains three records with the same Patient ID when the entity flag is not applied the records will be counted individually, if the entity flag is applied then the three records will be counted together as one entity within the cohort.
Cohort Builder and User Roles
Like all FAIR permissions, access to Cohort Builder is determined by the user's role.
The following system roles have Cohort Builder access by default:
- Data Manager
- Data Steward
- Standard User
Reviewing Cohort Requests
Cohort requests are reviewed and approved in the same way as dataset requests, and can be viewed on the My Requests screen.
However, when a cohort request is submitted, the reviewer is provided with a link to the cohort.

Dictionary Management
Query Builder
Cohort Builder uses the dataset dictionaries to build its queries of the underlying data. Therefore, any mismatches between the dictionary and the data will degrade the performance of Cohort Builder.
The Validation Report allows users to identify the following errors:
- Field exists in data but not in dictionary
- Field exists in dictionary but not in data
- Database and Dictionary Types do not match up
Where a field exists in the data but not the dictionary users will not be able to query the field in Cohort Builder.
Where a field exists in the dictionary but not the data, or where there is a type mismatch between the dictionary and data fields, this may cause the cohort query builder to error.
In all cases, the data owner must decide the appropriate resolution for an error.
Visualisations
The dictionary is also used to define and display cohort visualisations.
The field type determines which visualisations are available for a particular field. At present, the Cohort Builder supports four types of visualisation:
| Visualisation | Data Type Supported |
|---|---|
| Bar Chart | Text fields |
| Stacked Bar Chart | Text fields |
| Box Plot | X Axis - Text fields/Y Axis - Numeric fields |
| Histogram | Numeric fields |
Dictionary information is also used to populate the visualisations, with the field label used on the chart display.
Where a field has lookup values, the Description is used in the visualisation, not the Name:
In this example, the descriptions 'No family history of dementia' and 'Family history of dementia' are used to label the values in a bar chart generated from the data:

