

Box and whisker plot
Display the distribution of numeric data through their quartiles by creating a box and whisker plot. Add a categorical variable to compare the data within each category.
Details
Box and whisker plots display a five-number summary of the data distribution. The values included in the summary are minimum, maximum, lower quartile, upper quartile and median. The lines, known as the whiskers, extending out from the boxes show the variation outside of the quartiles.
Run the Box and Whisker module by selecting a numerical variable (y). To show the data distribution per category, select a categorical group variable (group).
Output
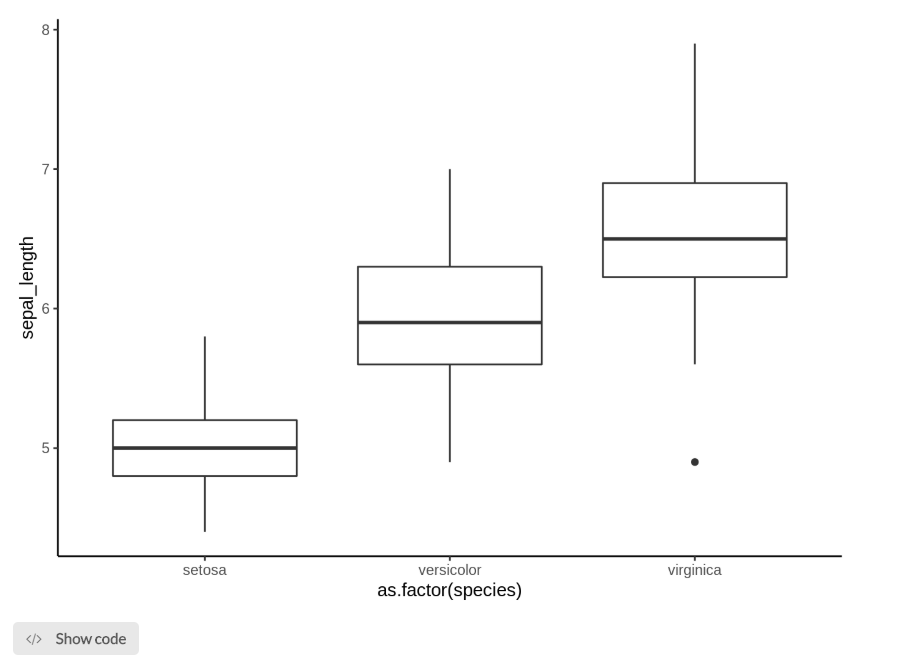
The example box and whisker plot below shows the comparison of sepal length distributions between different flower species.
Parameters
| Variable name | Required | Constraints | Description |
|---|---|---|---|
| y | Yes | Column Input. Integer, Decimal | Numerical variable upon which the data distribution will be plotted. |
| group | No | Column Input. Text, Integer, Boolean, Date, DateTime | Categorical variable upon which grouping will occur. |
| notch | Yes | Boolean | Adds a notch in the middle of each bar. Signals significance of the difference of medians between groups, default to off. |
| notchwidth | Yes | Decimal ranging from 0 to 1 | Manually edit notchwidth. |
| whisker_coef | Yes | Decimal > 0 | Determines the length of boxplot whiskers, defaults to 1.5. The whisker extends from the hinge to the largest (or lowest) value no further than `whisker_coef` multiplied by the inter-quartile range. |
See Also
Updated on December 19, 2022